UK pension withdrawals: 770,000 people drew in 2026 Q1
HMRC publishes the number and value of flexible payments taken from UK pensions every quarter. This page carries the full series from 2015 Q2 to 2026 Q1, the age profile of who is drawing, and what the shift from lump sums to recurring income means if you live outside the UK. Figures are from HMRC Private pension statistics, Table 9, released 30 July 2026.
Ten times more people, each taking 60% less
In 2015 Q2, the first quarter of pension freedoms, 78,000 people took a flexible payment and the average was £19,103. In 2026 Q1 the figures are 770,000 people and £7,688. That is 9.9 times as many people, each taking 60% less.
The number underneath explains it. In 2015 Q2 each person took 1.2 payments in the quarter. By 2026 Q1 that is 2.4. Withdrawals are no longer one-off lump sums. They are a recurring income stream, taken a few thousand pounds at a time.
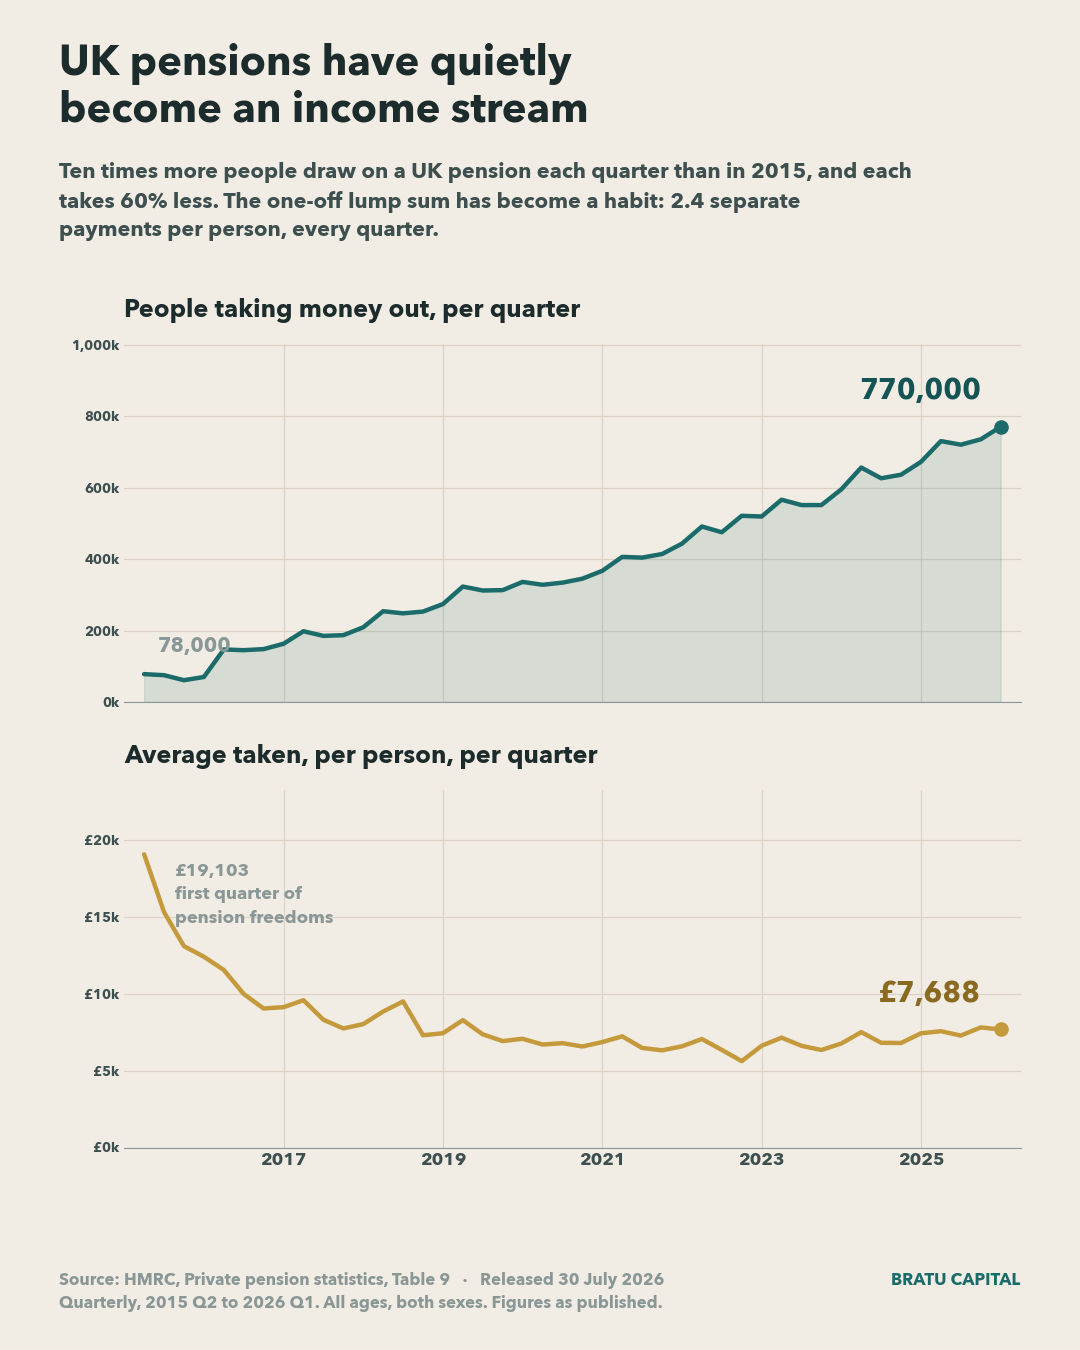
Quarterly figures, last twelve quarters
| Quarter | People | Payments | Value | Average each |
|---|---|---|---|---|
| 2023 Q2 | 566,000 | 1,335,000 | £4,050m | £7,155 |
| 2023 Q3 | 551,000 | 1,343,000 | £3,650m | £6,624 |
| 2023 Q4 | 551,000 | 1,366,000 | £3,500m | £6,352 |
| 2024 Q1 | 595,000 | 1,425,000 | £4,030m | £6,773 |
| 2024 Q2 | 656,000 | 1,512,000 | £4,930m | £7,515 |
| 2024 Q3 | 626,000 | 1,540,000 | £4,270m | £6,821 |
| 2024 Q4 | 636,000 | 1,598,000 | £4,330m | £6,808 |
| 2025 Q1 | 672,000 | 1,604,000 | £5,000m | £7,440 |
| 2025 Q2 | 730,000 | 1,744,000 | £5,530m | £7,575 |
| 2025 Q3 | 720,000 | 1,781,000 | £5,250m | £7,292 |
| 2025 Q4 | 735,000 | 1,876,000 | £5,750m | £7,823 |
| 2026 Q1 | 770,000 | 1,853,000 | £5,920m | £7,688 |
Full series runs to 44 quarters from 2015 Q2.
Annual totals
| Calendar year | Total withdrawn | Payments | Average per payment |
|---|---|---|---|
| 2015 (from Q2) | £3,440m | 304,000 | £11,316 |
| 2016 | £5,360m | 954,000 | £5,618 |
| 2017 | £6,380m | 1,529,000 | £4,173 |
| 2018 | £8,140m | 2,144,000 | £3,797 |
| 2019 | £9,190m | 2,821,000 | £3,258 |
| 2020 | £9,120m | 3,205,000 | £2,846 |
| 2021 | £10,700m | 3,830,000 | £2,794 |
| 2022 | £12,340m | 4,626,000 | £2,668 |
| 2023 | £14,640m | 5,293,000 | £2,766 |
| 2024 | £17,560m | 6,075,000 | £2,891 |
| 2025 | £21,530m | 7,005,000 | £3,074 |
| 2026 (Q1 only) | £5,920m | 1,853,000 | £3,195 |
People cannot be summed across quarters: the same person appears in more than one, so HMRC's quarterly counts are not additive. Only value and payment counts are totalled here.
Half of everyone drawing has not reached 65
In the 2025 to 2026 tax year, 1,265,000 people took a flexible payment. 644,000 of them, or 51%, were under 65. The largest single band is 60 to 64.
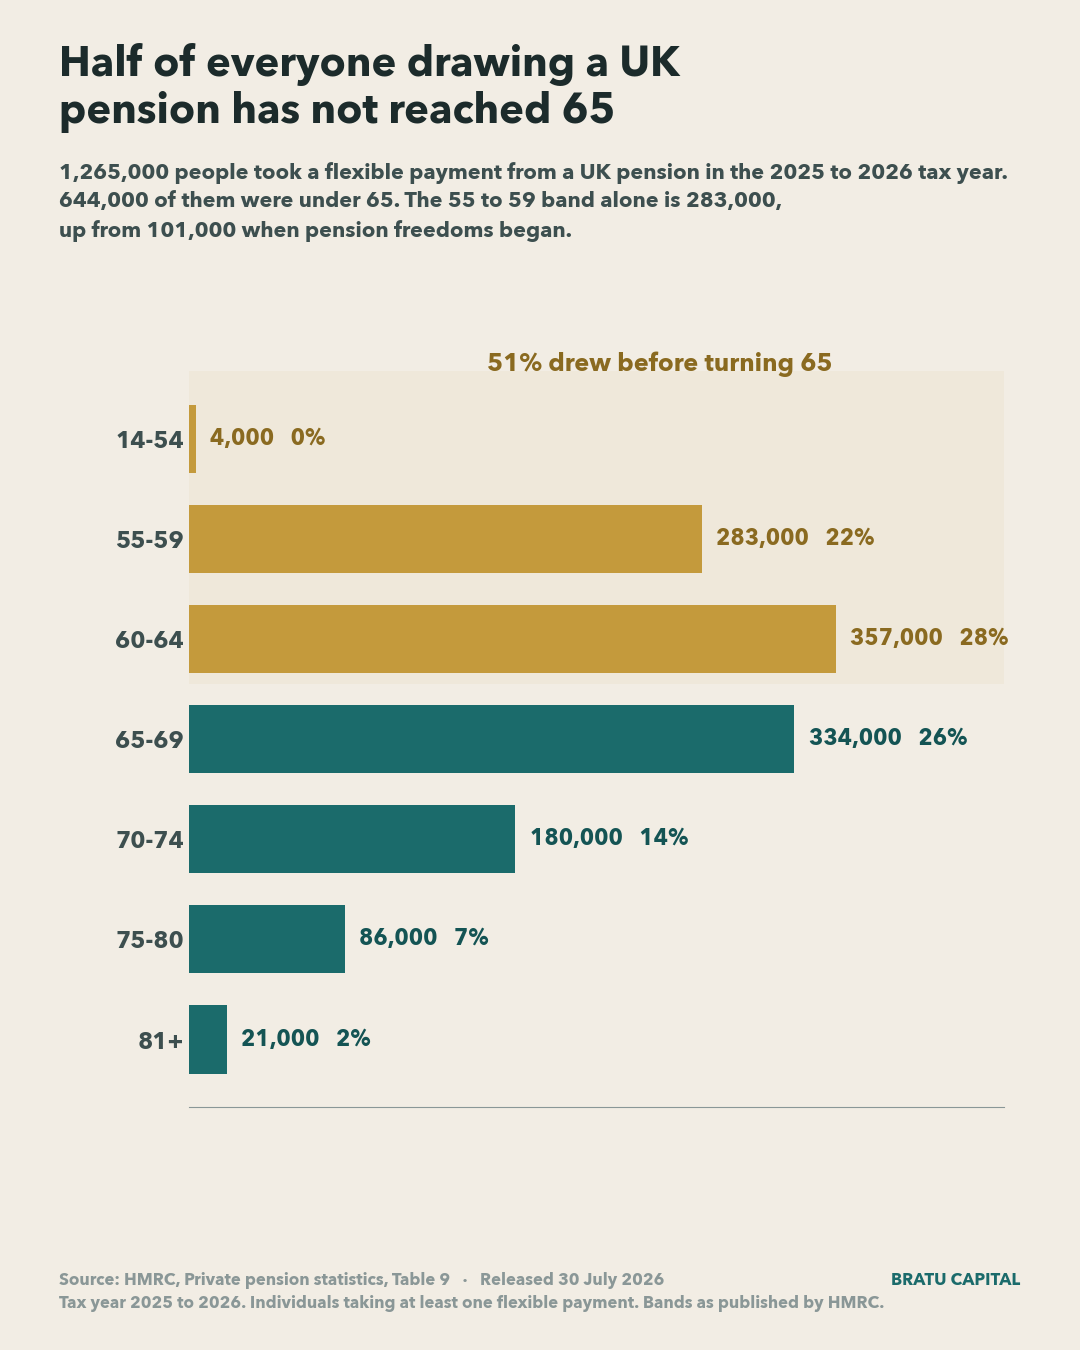
| Age band | People | Share | Value | Average each |
|---|---|---|---|---|
| 14-54 | 4,000 | 0.3% | £100m | £25,000 |
| 55-59 | 283,000 | 22.4% | £5,130m | £18,127 |
| 60-64 | 357,000 | 28.2% | £6,170m | £17,283 |
| 65-69 | 334,000 | 26.4% | £5,400m | £16,168 |
| 70-74 | 180,000 | 14.2% | £2,910m | £16,167 |
| 75-80 | 86,000 | 6.8% | £2,020m | £23,488 |
| 81+ | 21,000 | 1.7% | £630m | £30,000 |
Men take a third more than women, and the gap has not closed
In 2025-2026, 847,000 men took an average of £19,929 each. 418,000 women took an average of £13,110. That is a gap of 34%. Across the eleven tax years HMRC has published, the gap has stayed between 27% and 34%, and it is currently at its widest since pension freedoms began.
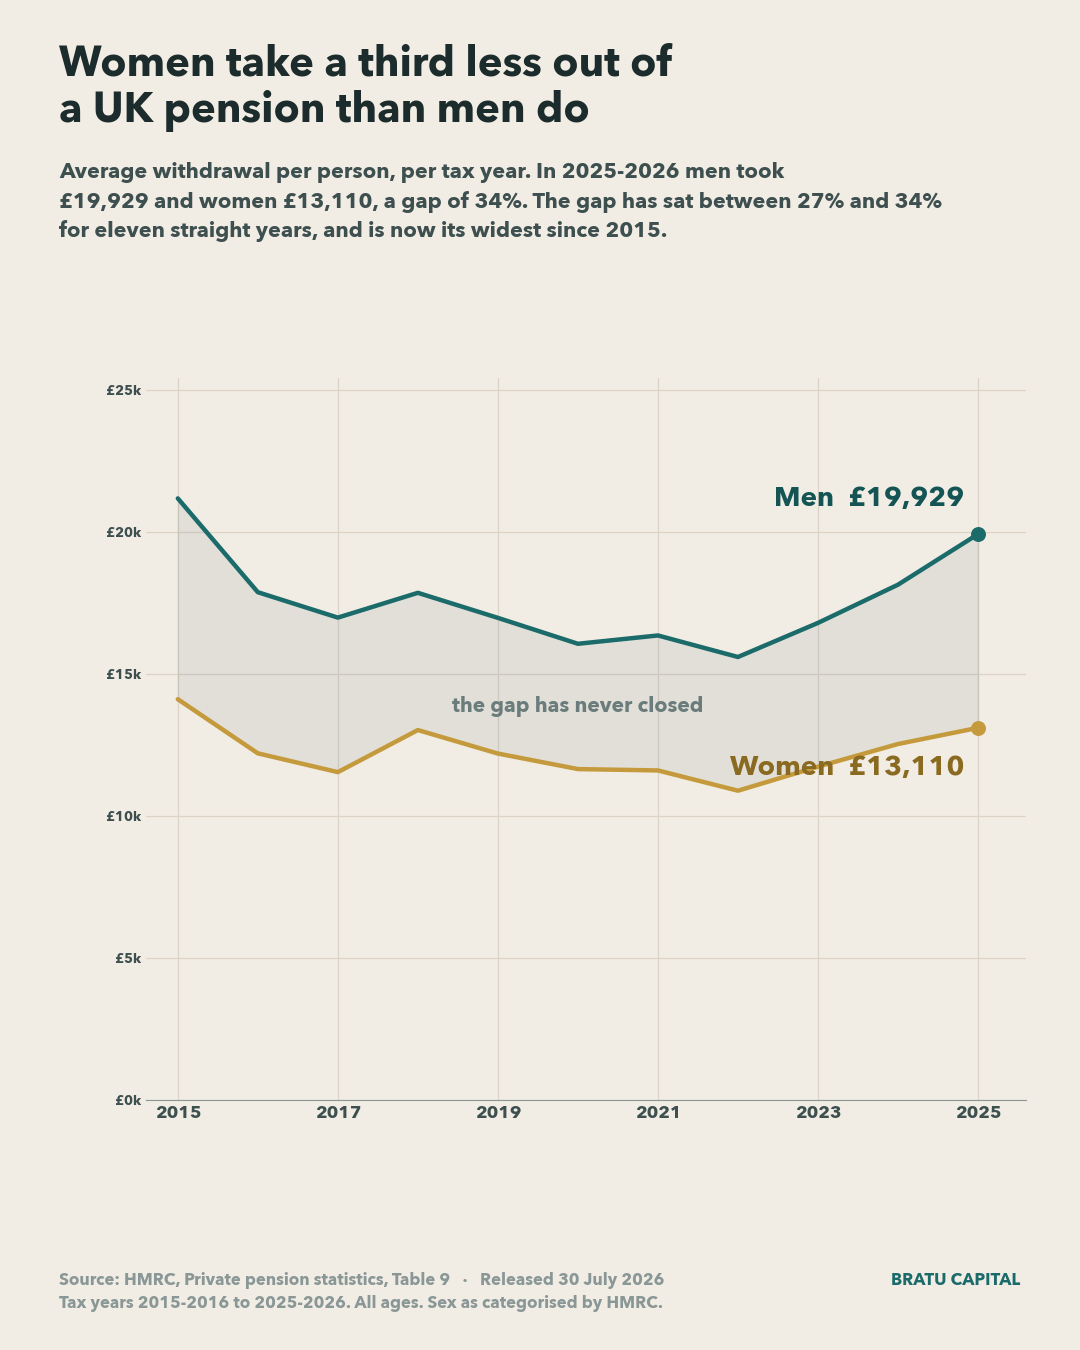
| Tax year | Men | Men, average | Women | Women, average | Gap |
|---|---|---|---|---|---|
| 2015-2016 | 160,000 | £21,188 | 68,000 | £14,118 | 33.4% |
| 2016-2017 | 260,000 | £17,885 | 113,000 | £12,212 | 31.7% |
| 2017-2018 | 299,000 | £16,990 | 129,000 | £11,550 | 32.0% |
| 2018-2019 | 365,000 | £17,863 | 155,000 | £13,032 | 27.0% |
| 2019-2020 | 424,000 | £16,981 | 186,000 | £12,204 | 28.1% |
| 2020-2021 | 435,000 | £16,069 | 193,000 | £11,658 | 27.5% |
| 2021-2022 | 514,000 | £16,362 | 236,000 | £11,610 | 29.0% |
| 2022-2023 | 621,000 | £15,604 | 290,000 | £10,897 | 30.2% |
| 2023-2024 | 682,000 | £16,804 | 327,000 | £11,743 | 30.1% |
| 2024-2025 | 767,000 | £18,149 | 374,000 | £12,540 | 30.9% |
| 2025-2026 | 847,000 | £19,929 | 418,000 | £13,110 | 34.2% |
Sex as categorised by HMRC. Records where sex is unknown or recorded otherwise are excluded from this table, so the two columns do not sum to the totals above.
What this means if you live outside the UK
A single lump sum is one taxable event in one tax year. A recurring stream is foreign income, and it is reportable where you are tax resident, under whichever double taxation treaty applies to you.
Those treaties are not interchangeable. Some allocate taxing rights on private pensions to the country paying the pension, others to the country where you live. Two people with identical pensions and different residencies can get different answers, so the treaty covering your own situation has to be read directly rather than assumed from another country's.
The behavioural point matters as much as the tax one. Taking a few thousand pounds two or three times a quarter feels like administration rather than a decision. Across 44 quarters it has become the normal way UK pensions are used, and most published guidance still reads as though people draw once.
Questions
How many people take money out of a UK pension each quarter?
In 2026 Q1, 770,000 people took a flexible payment from a UK pension, across 1,853,000 separate payments totalling £5,920 million. When pension freedoms began in 2015 Q2 the figure was 78,000 people.
What is the average UK pension withdrawal?
£7,688 per person in 2026 Q1. That is 60% below the £19,103 average in the first quarter of pension freedoms. The average has fallen because far more people are drawing smaller amounts, not because pots are smaller.
At what age do people start drawing a UK pension?
Earlier than 65. In the 2025 to 2026 tax year, 644,000 of 1,265,000 people who took a flexible payment were under 65, which is 51%. The largest single band is 60 to 64 at 357,000 people, followed by 65 to 69 and then 55 to 59.
How is a UK pension withdrawal taxed if I live abroad?
Where the payment is taxed depends on your tax residence and the double taxation treaty between the UK and that country. Treaties are not uniform on private pensions: some allocate taxing rights to the country paying the pension, others to the country where you live. Two people with identical pensions and different residencies can get different answers, so the treaty that applies to you has to be read directly.
Do men and women take different amounts out of a UK pension?
Yes, and the gap has not closed. In 2025-2026, 847,000 men took an average of £19,929 each, while 418,000 women took an average of £13,110. That is a gap of 34%. Across the eleven tax years HMRC has published, the gap has stayed between 27% and 34%, and it is currently at its widest since pension freedoms began.
Are people cashing out their pensions or drawing an income?
Drawing an income. In 2015 Q2 each person took 1.2 payments in the quarter. By 2026 Q1 that had risen to 2.4. The pattern is repeated smaller withdrawals, not one-off lump sums.
Source. HMRC, Private pension statistics, Table 9: flexible payments from pensions. Released 30 July 2026. Original release on GOV.UK.
Quarterly series from 2015 Q2 to 2026 Q1, all ages and both sexes. Age table is the 2025 to 2026 tax year. HMRC rounds payments and individuals to the nearest thousand and values to the nearest £10 million, and suppresses counts below 500. Averages shown here are calculated from those published figures and inherit that rounding.
This page is updated in place when HMRC publishes. Contains public sector information licensed under the Open Government Licence v3.0.